Related Links:IGM simulations |
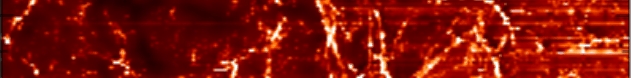
Structure of the Intergalactic MediumNumerical simulations of the structure of the Intergalactic
Medium in the context of Cold Dark Matter (CDM) dominated models show
that the most of the Universe is filled with a weblike distribution
of dark matter and baryons of low to moderate
overdensities. While the highest density regions form virialised
haloes that become the sites of galaxy formation, moderately overdense
structures form filaments connected at the haloes. Suspended between
the filaments are sheets with densities comparable to the mean density
of the Universe. The sheets in turn enclose low density regions.
The Lyman-α ForestNumerical simulations have been broadly successful at
reproducing the observed properties of the IGM as measured in QSO
spectra (e.g., Zhang et al. 1997, 1998; Meiksin et al. 2001). Most
striking is the agreement between the predicted and measured flux per
pixel distributions, with the models recovering the measured
cumulative distributions to a precision of 3-5% (Figure 1)
. This is an important success of the CDM model for structure
formation, especially in that no assumptions relating the scattered
light to the dark matter are required, except for the intensity of the
UV background, which may be determined by fitting to the mean
transmission of the QSO light through the IGM. This contrasts with
galaxy simulations, all of which may be compared with observations
only through extensive additional modelling of the amount of light
produced by stars inside the collapsed dark matter haloes. IGM
simulations instead are more of a non-linear extension of predictions
for Cosmic Microwave Background (CMB) fluctuations, bridging the
linear density fluctuation regime of the CMB with the highly nonlinear
fluctuation regime of galaxies. The IGM therefore provides an
independent and complementary means of testing cosmological structure
formation scenarios and constraining cosmological parameters. The best-fitting flat universe models impose the dark matter
density constraint 0.26 < ΩM < 0.43 (Meiksin et
al. 2001). The measured distributions of absorption line parameters
are moderately well recovered by the simulations, but statistically
significant differences remain. The measured widths of the absorption
features are significantly broader than the models predict (Figure 2)
. The disagreement in linewidths is particularly pronounced for
the weakest Ly&alpha absorbers, those optically thin at their line
centre (Figure 3) , suggesting that the discrepancy is
indicative of gas that is warmer than the model predictions throughout
the IGM, as these more rarefied systems occupy the underdense regions
between the galaxies (Zhang et al. 1998). A likely explanation is a
combination of additional heat input during the reionisation process
itself, as well as the possibility that HeII was re-ionized late (at z
< 3.5), resulting in a boost to the IGM temperature through the
additional photoelectric heating. Estimates show this brings the
distributions into much better agreement (Figure 4)
. Ultimately, precise modelling of of the widths of the absorption
features requires the inclusion of radiative transfer into the reionisation
calculation. ReferencesMeiksin A., Bryan G., Machacek M., 2001, MNRAS, 327, 296 Zhang Y., Anninos P., Norman M.L., Meiksin A., 1997, ApJ, 485, 496 Zhang Y., Meiksin A., Anninos P., Norman M.L., 1998, ApJ, 495, 63 |