The effect of non-linear evolution on the baryonic features
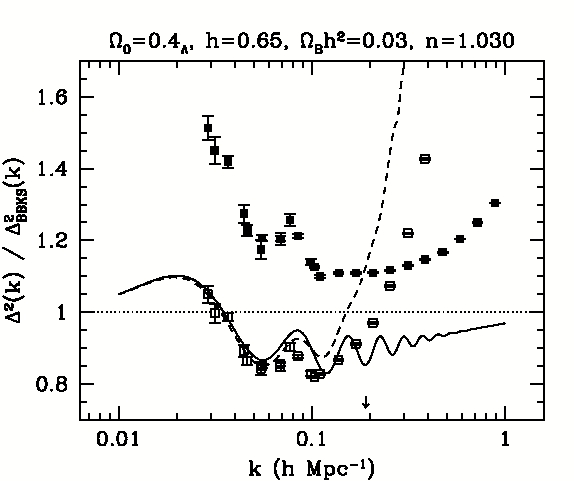
The effect of non-linear evolution on the oscillations in the power
spectrum. The solid line shows the ratio of the linear power spectrum for
a model with &Omega0 = 0.4, &Omega&Lambda = 0.6,
H0 = 65 km s-1 Mpc-1,
&Omegab h2 = 0.03 and n = 1.030 to a BBKS model.
The BBKS transfer function has &Gamma* = 0.198, and the model
is COBE normalised. The dashed line shows the ratio including 2nd
order corrections. The small arrow near k = 0.2 h Mpc-1 indicates
where &Delta2(k) = 1.
The open squares are the results from N-body simulations with the
Cold Dark Matter spectrum in real space, solid squares the results in
redshift space. Note that the oscillations for k > 0.1 h Mpc-1
are washed out. (From Meiksin & White 1999, MNRAS, 304, 851.)
Return to baryonic P(k) features