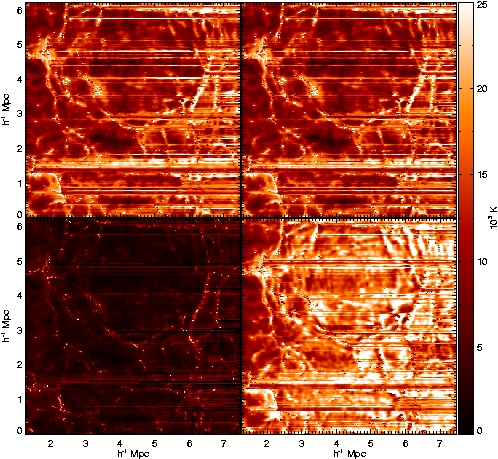
Temperature maps of the post-reionised IGM at z = 3. From top-left to
bottom-right the panels correspond to the power-law, mini-quasar,
starburst,
and hybrid source specta. The source is to the left. Cool (dark)
streaks are
shadowed regions. Hot streaks are regions recently unshadowed as the
ionisation
front breaks through a clump.
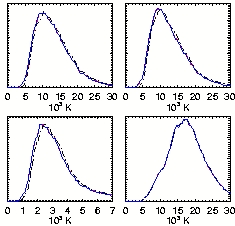
The volume-weighted temperature distribution at z = 3 for the
ionised gas only. From top-left to bottom-right the panels correspond
to the power law, mini-quasar, starburst, and hybrid model. The
colours/line type distinguish the redshift at which the source turns
on, with
z_on = 8 (black/dash-dot), zon = 12 (red/dashed),
and
zon = 20 (blue/solid). The dashed and solid lines nearly
coincide. Note the change in the temperature scale for the starburst
model.