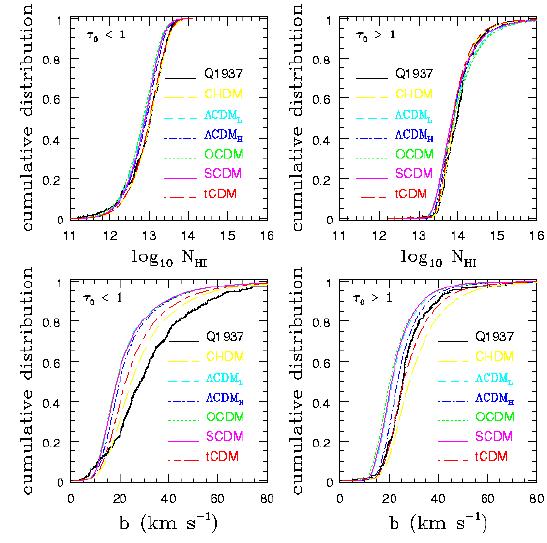
Comparison between the cumulative distributions of the neutral
hydrogen column densities (upper two panels) and widths (Doppler
parameters; lower two panels) measured in QSO Q1937-1009 and the
predictions of numerical models. The distributions are subdivided
into lines optically thin (left column) and optically thick (right column)
at the line centres. The discrepancies are much more pronounced for
the more ubiquitous weak (optically thin) systems than optically thick,
especially for the velocity widths. (From Meiksin, Bryan & Machacek 2001.)