Growth of correlations in the real space power spectrum
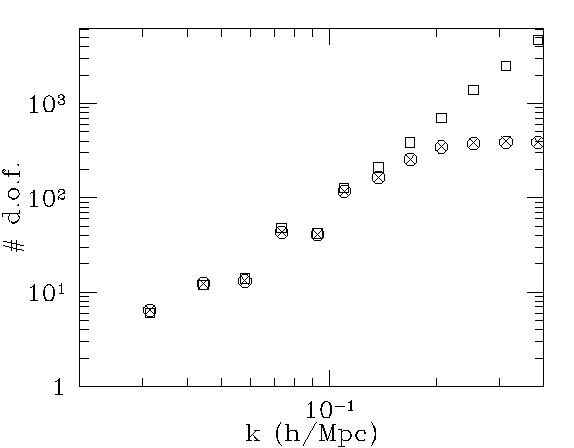
The number of degrees-of-freedom expected in each frequency band based
on counting modes in the simulation box (squares) vs the equivalent number
ndof found in the simulations (circles). Also shown are
maximum-likelihood estimates of ndof given by fitting the power
spectra to a &chi2 distribution (crosses). Correlations between
modes reduce the effective number of degrees-of-freedom at high frequencies,
and so increase the dispersion in the band-averaged power spectrum estimates
over the expectation for uncorrelated modes.
(From Meiksin & White 1999, MNRAS, 308, 1179.)
Return to non-linear P(k) correlations